
ISSN: 2511-7602
Journal for Art Market Studies
ISSN: 2511-7602
Journal for Art Market Studies
Thomas Skowronek
The article presents an inquiry into the methodological concerns of art market research from a cultural studies perspective. It focuses on the liminal operating space of data between pictures, writing, numbers, and language. While representing data, art market visualizations also reproduce big data’s epistemological grounds and strategic alignment. Therefore, it seems useful to conceive of big data as a dominant transdisciplinary factor of knowledge production. The arguments provided in this article are based on the assumption that mediality and interdisciplinarity are only partially a matter of choice. Thus, the possible influence of data mining and visualizations on elementary research techniques like reading and interpreting raises urgent and far-reaching questions.
Demonstrating that data’s performativity relies on the materiality of tools and machines as well as accompanying narratives and specific blind spots, the article refers to anamorphosis and anagnorisis as complementary visual and poetic concepts. They are organized along an interrelation of superiority and fragmentation that speaks of certainty rather deferred than ensured. This ambiguity and fragility allows for an aggregation of libidinal, discursive, and political forces. However, this strategic inconsistency is not part of big data’s popular image. Quite on the contrary, as art market visualizations often demonstrate. Frequently, they operate as symbolic machines that promise economic and visual productivity. Mutually reinforcing, visual observation and economic efficiency conjoin with the idea of abundant knowledge. Consequently, the main focus of this article lies on the rhetoricity of knowledge promises.
“Why maps can be so convincing [...] is that the rules of society and the rules of measurement are mutually reinforcing in the same image.”1
“[T]he visualization of the network revealed an unexpected result – the appearance of a substantial node in New York [...].”2 Observations like this from Pamela Fletcher and Anne Helmreich telling of surprising insights are characteristic for a large part of contemporary big data usage, particularly in the field of art market research. The technology’s potential for further research is readily emphasized. Usually, its epistemological capacity is associated with prospects of a superior vision. Across the disciplines, different voices join to form a common credo that augurs the uncovering of “unseen patterns”3 “undetected by the human eye”4 thanks to an “[a]ided perception and cognition” that “allows us to see data of any size [...] differently.”5 Thus, a dominant line in the rhetoric of big data visualizations emerges that raises questions about its structure and possible effects on knowledge production. For example, what could that new seeing of data reveal about the research on art markets and its underlying ideologies? What could an attempt to classify these developments look like? Also, what could become lost from view in times of such an enhanced visibility? Similar to pictures, visualizations are not only about the visual. As stressed by W. J. T. Mitchell, for example, pictures exist “as a complex interplay between visuality, apparatus, institutions, discourse, bodies, and figurality.”6 Accordingly, visualizations take place in a transitional zone as well. As could be expected, computational practices like quantifications and calculations play a decisive role here. However, visualization is not only about programming techniques. As the aforementioned statements indicated, data’s performativity relies on the materiality of tools and machines as well as accompanying narratives and specific blind spots.
The following observations, therefore, explore the formation of that assemblage at the crossroads of big data and art market research. It is here, presumably, where discourses and semantics interweave that a new framework emerges for what can be seen and known. Since visualization is about staging and translating data into comprehensible forms, that space in-between is not only extensive but most crucial. Here, phenomena of blindness and recognition concur with projected future developments and governmental power.7 A look at the epistemological tools developed here can provide a theoretical understanding of evolving and consolidating research approaches in an interdisciplinary environment. For these methodological reasons, I am interested in the liminal “operating space”8 of data between pictures, writing, numbers, and language and its implications for art market research. While the following pages provide a specific and to some extent a rather critical assessment of current developments, they do not, however, offer ready-made answers. Instead of a new method, the following thoughts present an inquiry into the methodological concerns of art market research from a cultural studies perspective. Instead of a report on indispensable criteria and prerequisites, or a reading and writing instruction for visualizations, they can be defined as an exploration into the narratives and semantics of big data visualization. In particular, they elaborate on the rhetoricity of knowledge promises. They examine how verbal and visual representations are connected to disciplinary and economic priorities.
In order to reconstruct big data’s academic appeal for art market research, it seems promising to ask about presumable epistemological genealogies and relevant cultural contexts. In order to reconstruct them, I will refer to anamorphosis and anagnorisis as complementary visual and poetic concepts.9 They are organized along an interrelation of superiority and fragmentation that speaks of certainty rather deferred than ensured.10 As will be shown, there is an economic functionality to this delay that goes beyond questions of mere efficiency. In fact, there is a relevant economic dimension to big data’s visuality. It consists of discursive, institutional, and political layers that shape big data’s social visibility. Along these lines, visualizations reproduce big data’s “epistemic machinery”11 and concomitant strategies of naturalization and dissimulation. Despite their variety and inconsistency, at the heart of these strategies lies the tendency to hide contingency and to produce an image of necessity.
Although comprehensible from a media theoretical perspective, it is striking that research tools can have or at least may be perceived as having semantics of their own, often in contradiction to their initial purpose. Obviously, we have to deal with tools telling different, complex and inconsistent stories that superimpose themselves over the object of research like a veil. Lifting that veil, however, would not allow for an unobstructed view of the object. In doing so, it would rather vanish instead. In other words, there is no understanding of big data’s visualization and its epistemological implications by referring to its research agenda only. It is one thing to listen to what it says and it can be quite another to look at what it does. Without question, a critical awareness among art historians of the possible contradictions that might arise between technical objectives and humanistic research does exist.12 The arguments provided in this article, though, are based on the assumption that mediality and interdisciplinarity are only partially a matter of choice. It is about a shift of focus to the margins and the vagueness of knowledge production. With these performative and theatrical notions in mind, last but not least, the following pages ask how to do things with research tools.13
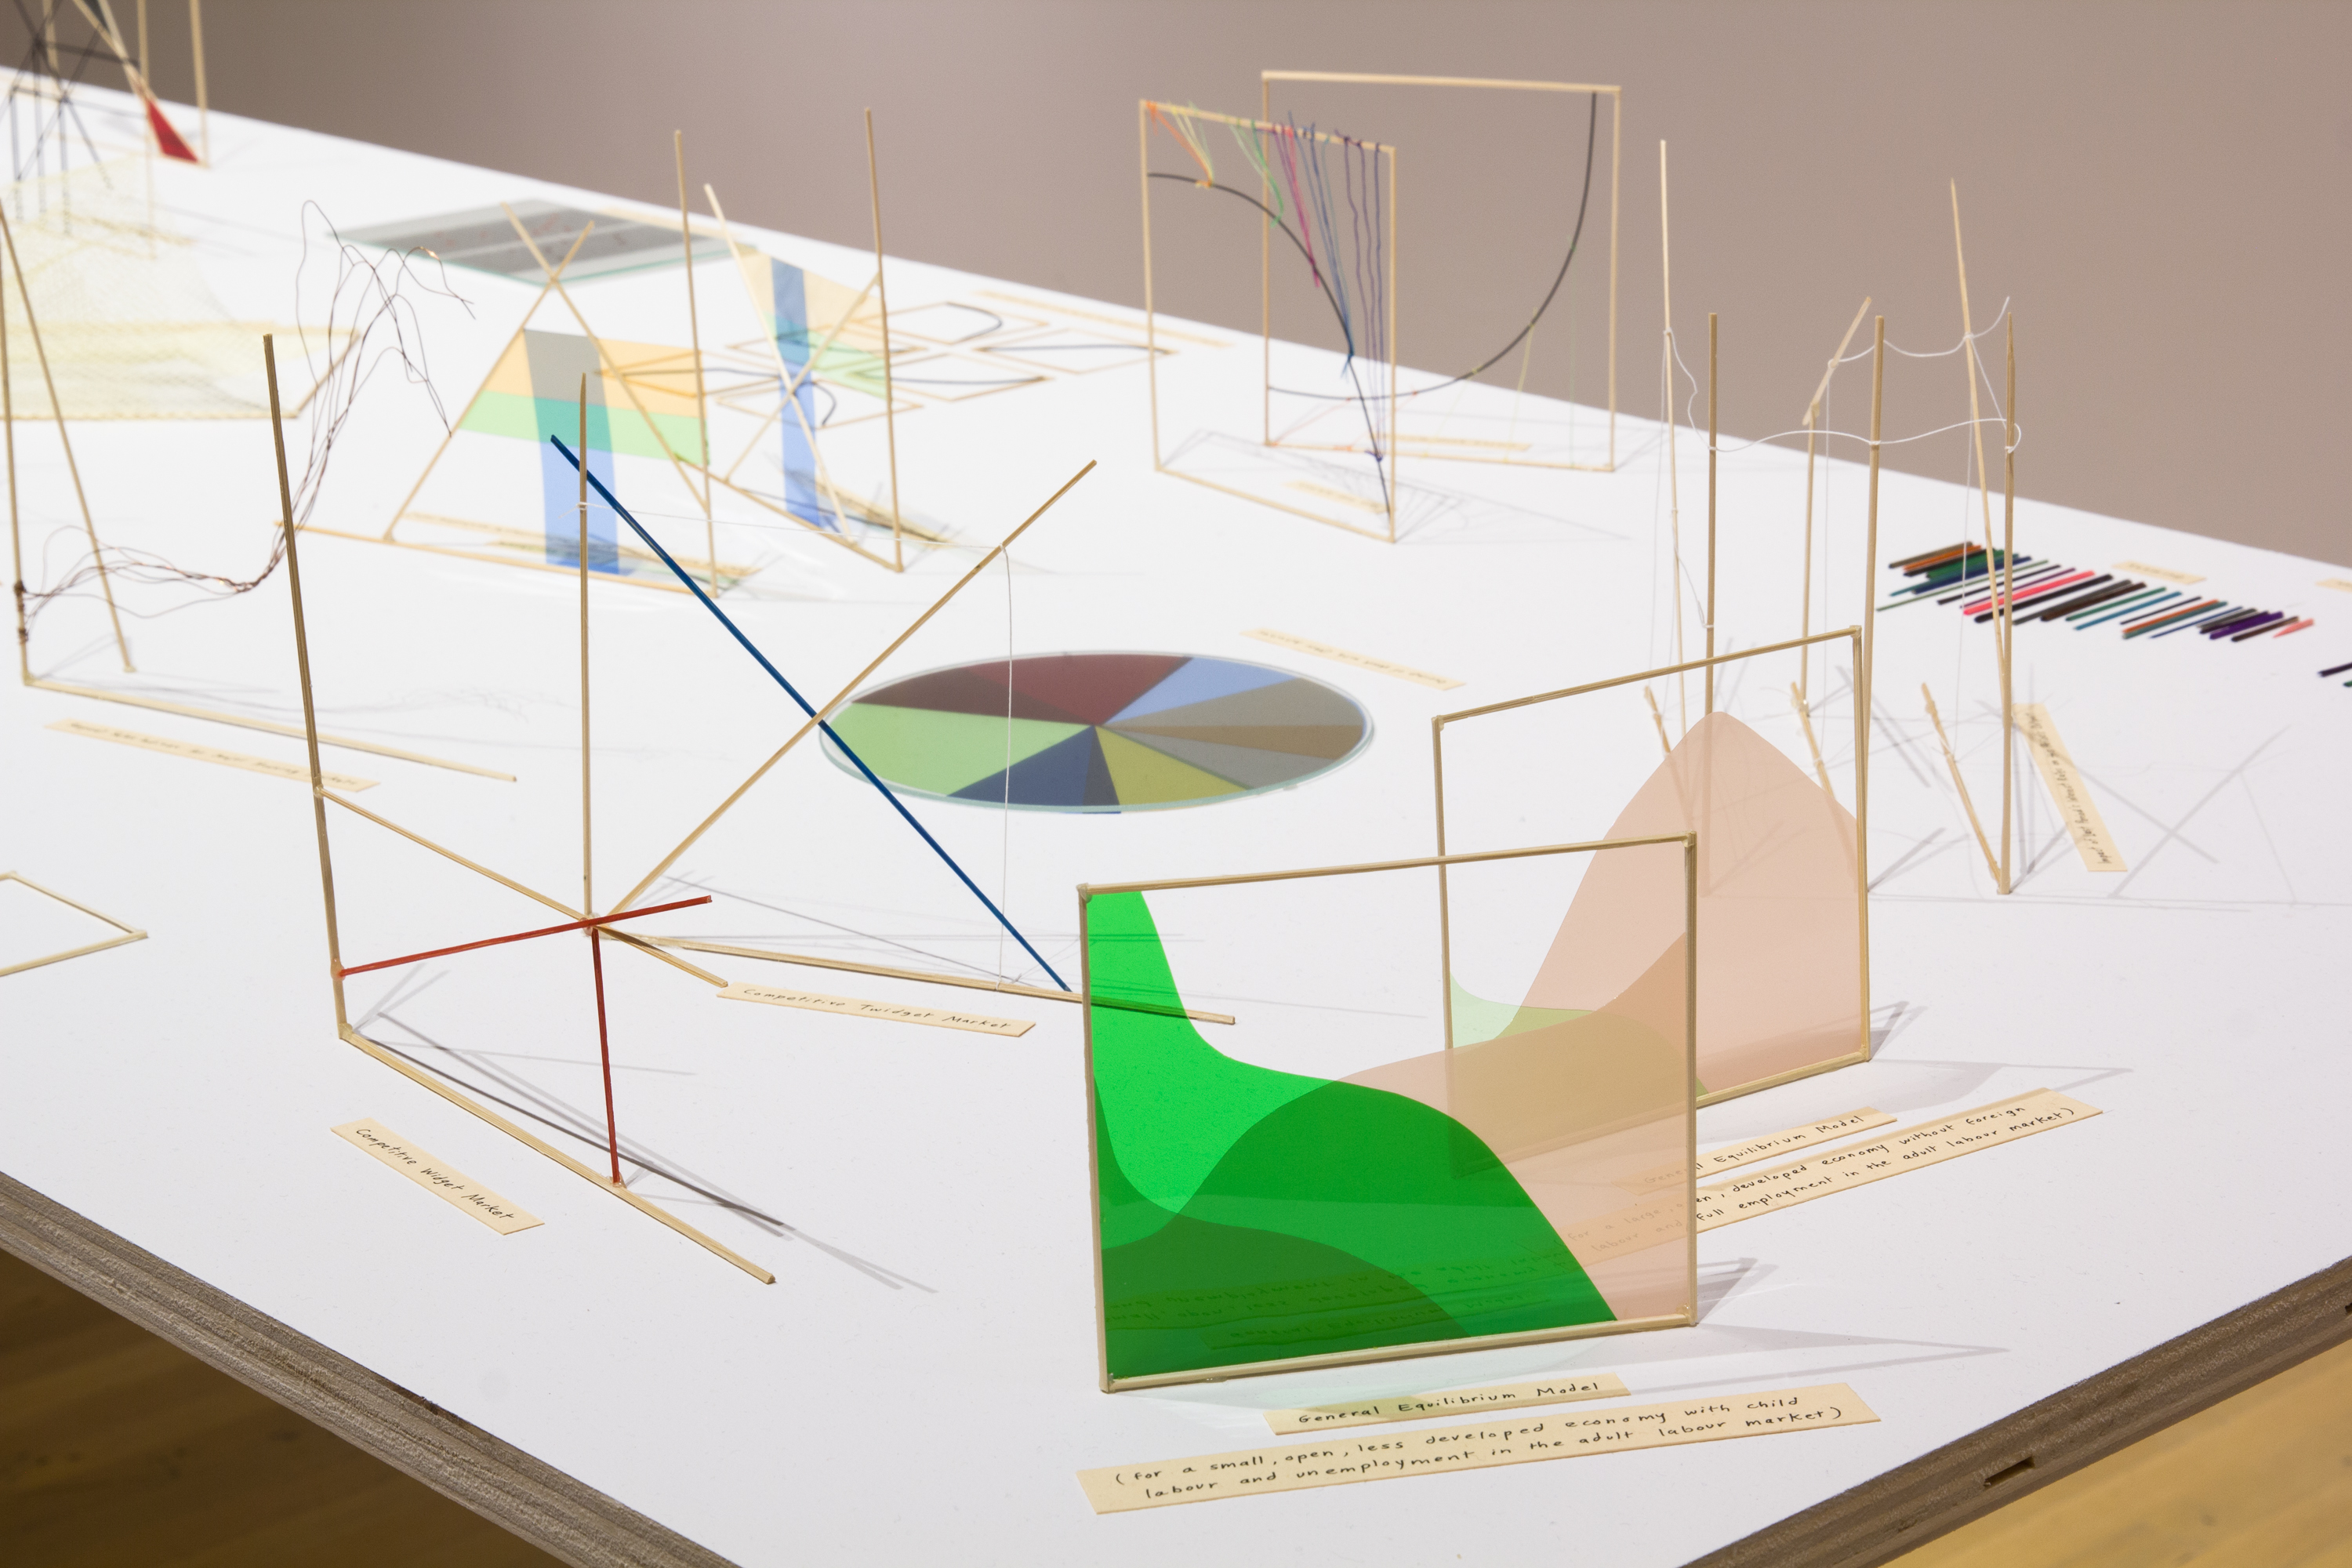
Fig. 1 The Prophets by Richard Ibghy and Marilou Lemmens may be understood as an allegory for the materiality and aesthetic force of visualizations as well as their inconsistency, implicit fragility and political subtexts, especially in the realm of economy and finance. Richard Igbhy & Marilou Lemmens, The Prophets (detail). 2013-2015. Installation view, La Biennale de Montréal, Musée d‘art contemporain de Montréal, Montréal, Canada. The first iteration of the piece was a commission of the Henie Onstad Kunstsenter.
Standardization is a precondition for data analysis.14 Determining the appropriate categories (artist, business partner, genre, for example) is crucial.15 This information determines the frame of what can be recognized and analyzed. Changing subcategories, however, in order to include multiple transactions of one object, for instance, is common practice.16 This subsequent restructuring is called cleaning.17 Data preparation evolves around this very making and unmaking of contingency and the petrification of traces. Comparable to scientific research, it’s an ongoing process working respectively towards the production of “technical things”18 (Rheinberger) or “immutable mobiles”19 (Latour). They are intended to enable a cross-system transfer of data.
In spite of this reflexive loop and connective imperative, in the humanities, standardization is perceived as problematic. Here, a sense for the object’s “idiosyncrasies”20 is greatly appreciated as highlighted by Victoria Szabo: “Variant spellings, for example could be important to tracing the provenance of a particular object.”21 Speaking of visualizations, a lack of “expressing interpretative complexity”22 and “concepts of doubt and uncertainty”23 is present, as painfully noticed by Johanna Drucker and Sophie Raux, for example. However, even the humanities with their usually rather distant attitude towards quantification display not only resentment.24 Often, the dividing line between enthusiastic supporters, balanced approaches, and harsh criticism remains blurred. For the time being, therefore, the “disagreements in the art history community about the value of digital research, teaching, and scholarship”25 seem to prevail. This is due also to the ambiguities of terms like “Big Data” and “Digital Humanities” with respect to their scope and denotation.26 To a certain extent, though, these challenges concern economics, biology and other disciplines as well.27 Moreover, these meta-scientific considerations point to big data’s cross-cultural scopes of application. In this respect, it should be emphasized that research based on big data and visualizations on the one hand and comparable practices in commerce and culture on the other are not identical. However, they might share similar interests and ideologies. In order to reconstruct these specific points of contact and transversal mechanisms, big data should be seen in a wider context. Speaking of its image, therefore, it seems useful to conceive of big data as a dominant transdisciplinary factor of knowledge production. Hence, the possible influence of data mining and visualizations on elementary research techniques like reading and interpreting raises urgent and far-reaching questions.28
In view of promising perspectives, big data’s limitations are often perceived as secondary. Today’s discourse on data strongly relies on the idea of total informational control.29 Many would agree with Franco Moretti: “If we want to understand the system in its entirety, we must accept losing something.”30 Lev Manovich, for instance, is confident “that a systematic use of large-scale computational analysis and interactive visualization of cultural patterns will become a major trend [...].”31 Other researchers such as Manuel Lima, Maximilian Schich, and Victoria Szabo, generally, seem to be of a similar opinion. They emphasize a “prosthetic effect of the database system”32 enhancing vision and cognition. Consequently, this prospect of prosthetic enhancement refers to the topos of a “global nervous system”33 and “the prospect of a human collective intelligence”34. Within that imaginary space, an objective totality of positivistic knowledge exists that could be delivered to all, fairly and without discrimination.35 Basically, these projections share a common rhetoric structure and epistemological orientation. It is avant-garde in its formalism, totality and socio-technical stance. As such, it is a contemporary version of the creation of a new man and a new vision.
Arguably, these viewpoints represent a dominant position in humanistic big data visualization. Largely in line with them, art market researchers like the aforementioned Victoria Szabo as well as Pamela Fletcher, Anne Helmreich, Béatrice Joyeux-Prunel and others promise to refute “the official narrative”36 or “to view the historical record in new ways [...].”37 Often, these dynamics coincide with a panoptic language of superior overview. In particular, this is the case in the visualization of networks: “By zooming in into an individual within the network of relations, one could see, for example, that Juan Boussemart was a nodal figure worthy of further research attention.”38 In this ekphrasis by Victoria Szabo, visual superiority and epistemological gain conjoin. Following the researcher’s perspective from a general overview to a particular object, they take the viewer from a God’s eye view position down to the concreteness of earthly matters. On a phenomenological level, drawing the viewer into the picture and “zooming” along an edge become mirroring actions. In that regard, s/he becomes that gaze of God that propels subsequent research. In part, these metaphysical connotations arise out of the complexity of the data and the chosen form of visualization. In order to decipher individual nodes and edges, in order to see who is connected to whom, for example, the resolution has to be increased or decreased. Otherwise, the whole structure would remain incomprehensible.39 In other words, the view has to shift.
This connection of seeing and moving is of particular interest. It brings to mind historic dynamizations in art and perception in the first half of the twentieth century.40 Virtually, there is a constructivist aspect to this kind of visualization worth mentioning,41 for instance, in the process of establishing a desired visual constellation via zooming. As it moves and grows, the network seems to develop a life of its own. The visualization operates as a dynamic model that produces the concreteness and clarity of the research object. Moreover, the network visualization literally stages the rationality of its method as a spectacle and puts its power of epistemic persuasion before the viewer’s eye. It visually reproduces and translates data structure and highlights these visual capacities as well. Thus, several visual layers are being addressed at the same time. With good reason, the visual dimension of big data therefore motivated art-histori(ographi)cal investigations. For example, there is some evidence for the idea of relating current developments to the avant-garde.42 In addition, references to Aby Warburg’s Mnemosyne Atlas are most prominent.43 The following pages, however, consider early modern experiences in technology, politics, and art at least as fundamentally important for an understanding of today’s epistemological culture.
Big data is not about volume. Rather, it “is characterized by being generated continuously, seeking to be exhaustive and fine-grained in scope, and flexible and scalable in its production.”44 In several aspects, big data is about becoming. Data is not given but made in a technological environment “that comes to stand between the knowing subjects and the objects of knowledge [...].”45 Correspondingly, visualizations are not mimetic reproductions of data.46 Instead, they offer “views from certain vantage points, using particular tools, rather than an all-seeing, infallible God’s eye view [...].”47 Nonetheless, residual effects of traditional modes of reception facilitate a mimetic interpretation. As Joanna Drucker critically observes, “because of the representational force of the visualization [quantitative information presents itself] as a ‘picture’ of ‘data’.”48 As shown above, describing visualizations in the language of ekphrasis enhances the idea of data’s visual richness. It seems as if this rhetorical framing and its interpretation as a symbolic reproduction of objects serves as a model to install a similar ‘before and after’ principle in data usage. In addition, matters can be complicated by the fact that the analogization of seeing and “zooming” potentially could rely on art history’s citation force. Keeping with Roland Barthes,49 references to art history, especially as an institution harbouring mankind’s visual knowledge, could catalyze a naturalization of data’s visuality as a traditional way of seeing things. This seems to be true even for critical remarks, for example, when Facebook’s visual impact is considered more relevant than that of the Paris Salon.50 These references help to reproduce the notion of a superior vision. Accordingly, the dominant visual model mostly associated with big data is a panopticon.51 Indeed, visualizations function as epistemological instruments with deviations and distortions. However, there exist productive reflections on the different layers and contexts of data visualization. To refer to “a parallel world of false presence”,52 therefore, ignores the imaginary trickiness and dynamism of data that is characterized by a withdrawal of certainty on the pictorial level as well.
That interrelation of superiority and fragmentation corresponds to the technique of anamorphosis. Historically associated mostly with the Baroque, anamorphosis also proves to be suitable for elaborating on today’s visual regimes in their necessarily ineluctable limitations.53 Therefore, rather than as a historical technique of projections, anamorphosis serves here as an epistemological figure. However, references to technological and historical aspects remain paramount. The term can be translated as “biformic”, “counter formic” or “transformed”.54 Because of its anamorphotic skull, The Ambassadors (1533) by Hans Holbein the Younger is regarded as one of the most prominent examples of its artistic deployment. Speaking of technical aspects, anamorphosis is associated with kinetics or the use of instruments.55 In The Ambassadors, for instance, both aspects are relevant. Since the viewer has to move sideways in order to see the skull, he is bound to lose sight of the rest of the scene depicted. The scientific instruments on display, in turn, refer to the geographic and geopolitical quantification of the world that is represented, as well as to the quantifications of the central perspective relevant for depicting this world-view.56 More profoundly, that meta-pictorial twist corresponds to the “oscillation [...] between transparency and opacity”57 facilitated by the pictures contrasting visual models, central perspective and anamorphosis. These interrelations constitute a pictorial level that is both visual and non-visual, both part of the picture but also excluded. As if to confirm that images are not only visual, anamorphosis operated as part of a theatre of knowledge. Visuality was staged as a bodily, technical, and epistemological spectacle. This shift from optics to aesthetics soon proved beneficial to philosophical operationalization of anamorphosis as well.58 Leibniz, for example, referred to the anamorphotic mirror as a metaphor for the subject’s distorted view-point.59 Thus, anamorphosis can be regarded as much as a technique of visual mastery as it can be a source of potential irritation. Not least because of these liminal features, it seems particular suitable to serve as a model for analyzing visual complexity and epistemological challenges.
Although seeing invisible things remains a big promise, generally speaking, data is becoming too complex for visualization. “As data sets become richer and more complex [...] it is difficult to simply look at the data and visually identify patterns [...].”60 Data visualization, it turns out, appears to be less an augmentation of vision and “our reasoning capacities”61, as envisioned by Schich and others, than a potential factor of sensory and cognitive overload. A temporal blink of memory remains necessary. It’s a moment of translation, on the technical as well as on the epistemological level.62 Wendy Hui Kyong Chun describes this as follows: “When the computer does let us ‘see’ what we cannot normally see, [...] it computes. In order to become transparent, the fact that computers always generate text and images rather than merely represent or reproduce what exists elsewhere must be forgotten.”63
However, every visualization is characterized by systemic distortions.64 The central perspective, for instance, achieves its approximation to and appearance of normality and natural vision from one viewpoint only.65 Nonetheless, a specific disparity arises between the “spatial methods of the mathematical and physical sciences” and their calculus on the one hand and the claim “to produce an enhanced version of perception, to capture a world of flux, a ‘totality of images’, data streams and becoming” on the other.66 It is not so much deception and simulation that is at stake here, nor the fact that visualizations represent data as something rendered and cleaned. Indeed, it is even impossible to ‘see’ data directly as Alexander Galloway reminds us: “[D]ata, reduced to their purest form of mathematical values, exist first and foremost as number, and, as number, data’s primary mode of existence is not a visual one.”67 However, this “numerical difference” that renders a social substantiation of computer calculation impossible,68 becomes a projection screen for phantasms about data’s potential, in particular its visual capacities and corresponding enlightening rationale.69 In other words, the unrepresentability of data becomes a machine for phantasmatic desires working exhaustively on this apparent obscurity. Similar to data’s representational fallacy mentioned before, the main reasons for this – beyond the numerical difference – are traditional modes of interpretation, a mix of ignorance and credulity,70 as well as a desire for some of big data’s appealing aspects. Enlightening topoi like rationalization and democratization, for instance, are quite frequently reiterated and discursively reproduced as special advantages. Correspondingly, the assumption that more data “could help decipher the market”71 is quite common. This hermeneutical drive, however, should not be understood in terms of curiosity alone. Last but not least, it is an attempt to incorporate the unknown and to mitigate its uncertainty. Since early modern times, quantification was closely linked to visualization as a means of control and management.72 Similarly, today’s visualizations combine technological precision with rigid quantification in conjunction with procedures of naturalization in the sense of Roland Barthes, with techniques that contain contingency with the impression of necessity.73 This interrelation of visual superiority and structural blindness corresponds to anamorphosis. Data’s anamorphosis, in particular, consists of three aspects: representational limitations, a complementary imaginary of efficiency and potency, and a transversal trajectory with a desire for totality.74
Data’s “scopic regime”75 produces visuality in different ways.76 Like in early modern times, there is a spectacularity associated with data that stems from its institutional and cultural contexts. In anamorphosis, most crucial is the moment of recognition when “the viewer’s movement from visual confusion to visual clarity”77 occurs. It is argued that discourses on “unexpected result[s]”78 constitute a verbal counterpart to this moment of cognition. In the above-mentioned examples, an obsolescence of traditional knowledge as well as paths of future research were indicated. Here, data visualization and interpretation mutually reinforce the establishment of a new viewpoint. In a comparable manner, visual and verbal ways of reasoning pave the way for knowledge production. In order to take a closer look at these oral and literal reassurances of big data’s intelligence potential, the poetic model of anagnorisis seems to be a promising reference.79 It is translated as “recognition, discovery, or disclosure”80 and is characterized usually by a “a change from ignorance to knowledge”81 that gives insight into personal relations and contexts as well as a prefiguration of further actions. Historically, anagnorisis is associated with classic antiquity, especially with Aristotle and his thoughts on poetry. Even in past times, though, the question of recognition soon proved to be of philosophical interest as well.82 Further transformations of anagnorisis’ functional and semantic content followed.
Certainly, today’s research contexts can hardly be compared to literary works or ideal-typical plot structures, at least not without some significant adjustments. When looking for epistemological models with which to structure knowledge processes, though, it can prove helpful to refer to poetics. In this regard, one might think of Hayden White’s analysis of the lines of argumentation in nineteenth-century historiography and their tropological and narrative structures.83 In art market research, Olav Velthuis convincingly adopted this approach in his analysis of gallerists’ rhetorics.84 Speaking of rhetorics in the given context, Deirdre McCloskey’s findings on the concept of significance in econometrics are also worth mentioning. According to her (and Stephen Ziliak), a deliberate mixing of statistical and economic relevance in economic theory is related to ambiguity, dissimulation and ignorance on the rhetorical and institutional level as well.85 When analyzing persuasion and rhetorics, these three perspectives focus not only on phenomena of wording (elocutio in classic terms) but also point to associated desires, strategic interests, and institutional contexts. Thus, they highlight the ambiguous dynamics at the intersection of history, economics, and art as a poetologically suitable object of research. The following remarks, however, cannot rely on a comparably extensive range of material. Instead, they are more speculative in nature.
In modern times, anagnorisis played a prominent role when social identities were at stake. In literary texts of the Enlightenment, anagnorisis is basically a poetic technique for conveying notions of certainty and restoring order.86 Here, the uncovering of truth demands an appropriate reaction. Mostly, moments of anagnorisis were therefore also moments of decision.87 In data visualization, anagnorisis takes place when networks reveal previously unknown relations, for example. Similar to classic drama, the moment of recognition has to do with agency and power of action. When pieces assemble to pattern, a moment of “visual mastery”88 occurs that conveys to “its programmers and users alike a sense of empowerment, of sovereign subjectivity [...].”89 Almost stereotypically, this eureka moment evokes a new perception of the observing subject and the object observed. It is a staged moment, however, shaped by accompanying institutional, computational and visual factors. In that liminal “operating space”90 of data, different energies and influences interweave and shape the researcher’s epistemological horizon. Similar to anamorphosis,91 the distance between subject and object seems to diminish. For a second, data or, rather, its social projection “looks back at us”92 and it seems almost possible to reconnect with its transcendental position.
However, this moment of recognition is liminal indeed. A tension remains between the order perceived and its potential instability.93 For instance, it has to be decided how to exploit the results: What do they really mean? How can they be integrated into the bigger picture? In other words, the eureka moment has to lose its eccentricity. In order to be processed it has to be mitigated, revised, and normalized. Basically, this is a common process of knowledge production not restricted to big data or even science at all. Similar to law, theatre, and social life in general, these moments of recognition and agency are also intertwined with phases and states of disempowering.94 What is interesting, though, are the institutional context and the computational aspect that makes anagnorisis a matter of probability. Data visualization equals a stage where limitations and deliminations of optical, technological and epistemological visions are explored. This theatricality of big data evokes semantics of the laboratory and comparable institutional sites of knowledge production. Speaking with Bruno Latour, “[w]hat we are really dealing with is the staging of a scenography in which attention is focused on one set of dramatised inscriptions [read here: anagnorisis, TS]. The setting works like a giant ‘optical device’ [read here: anamorphosis, TS] that creates a new laboratory, a new type of vision and a new phenomenon to look at.”95 Like in a well-known play with its familiar plot structure, with data becoming more complex the number of anomalies produced is also expected to rise.96 Consequently, this would also increase the moments of unexpected results. However, this increase in numbers will not necessarily last forever: “Anagnorisis makes a whole hidden structure of relations intelligible. Yet the satisfaction is also somehow excessive, the reassurance [is] too easy [...].”97
From this perspective, epideictic critiques of big data’s potential appear as a prefigured anagnorisis of technological and epistemological conditionality. The inclination could be to subsume these virtual glorifications as rhetorical gestures towards a new technological and scientific environment. Certainly, much of this is true and much art market research relying on big data even dispenses with eulogies of this sort.98 However, the main point here is that today’s situation is not as new as it might seem. The references to and similarities with the Avant-garde indicate this. However, anagnorisis refers not only to visual and verbal aspects of staging research but points to underlying scientific and political desires as well. In order to understand big data’s libidinal economy, it is important to look at the wider context.
Basically, technology is about technology. As indicated before, though, it is connected to different practices and ideologies that shape its social body. When researchers like Szabo speak of technology’s “potential as tools for research discovery and expression”,99 It is, therefore, important to keep in mind technology’s imaginary potential, its capacity to represent research potential, while dissimulating its own involvement and desire for reproduction. Technology might appear as an objective tool for knowledge production while being embedded in various uses and interests. Seen from this macrolevel,100 Galloway’s emphasis that “any data visualization is first and foremost a visualization of the conversion rules themselves” and that “visualization wears its artifice on the sleeve” seems helpful.101 Beyond numerical procedures, these rules are based on different cultural, political, and disciplinary contexts with their processes of decision-making and conflicts of interest.102 Thus, representations of data can be interpreted as figurations of desires underlying these transformations. In that sense, art market visualizations are characterized by a comparable urge to represent their own “logic of necessity”.103 To represent big data’s “volume, velocity, and variety”104 different ways of transforming are available. In art market research, topological and geographical representations seem to be most prominent.105 According to Manuel Lima, there are genealogical reasons for this:
“A highly influential tradition for network visualization, besides the intellectual legacy of graph theory and the recent advancement of computer graphics, is cartography. From the outstanding contribution of Ptolemy’s Geographia (Geography) (ca. 150 AD), almost two millennia ago, and the notable mapmakers of the Age of Exploration – which took place during the fifteenth, sixteenth, and seventeenth centuries – to the explosion of statistical mapping, or ‘thematic mapping,’ in the mid-nineteenth century, the ancient heritage of cartography provides a rich setting for the present development of network visualization.”106
Similar to cartography’s claim “to provide a synchronous picture of the world,”107 network visualizations are about an adequate representation of market actors, networks, and art-works in circulation. In addition and to the same extent, that picture will also be about the materiality of the tools employed. In this regard, the development of statistics had a fundamental impact on science, the economy, and visual culture in general.108 In particular, the financialization of the art market had a lasting impact on its epistemological culture.109 It influenced the way plausibility is produced. Visualization techniques helped to solidify the notion of ‘the economy’ as a “real object”.110 They facilitate the space in and through which it “could be imagined to grow [...].”111 Graphs, for instance, are exemplary tools used not only to describe complex dynamics. In addition, they show harmonizing effects on the relationships represented. Thanks to their analog continuity comparisons with natural processes become plausible.112 By enhancing diagrammatic representations with aspects taken from ‘real life’, graphs turn into cultural techniques of “ideological relevance.”113 Visualizations of art market networks can show similar effects of naturalization, based on the fading out of contingency and the emphasis of an inner necessity. However, these naturalizations do not have to refer to ‘nature’ at all.114 The crucial point, rather, is a successful inscription into a dominant world model according to culturally established norms. From this epistemological perspective, a similarity between the trained instinctiveness to associate something with nature and the adopted naturalness to perceive something as a work of art can be seen.115 Aesthetic education, in particular, is a way of interweaving nature and culture and shaping perception as well. It is a process of disciplining that can have political implications.116
When a synoptic view presents the totality of network connections, spatial relations often dominate temporal aspects. In this totality of its actual and potential connections and meanings, the network appears as an entity beyond time, as a solid structure made from enduring materials. Here, spatiality and form conjoin in a sculptural shape of the market. This nodal sculpture is presented from an auctorial perspective that allows for free mobility. In the eye of the beholder, spatial and temporal distances melt into a permanent now. Depending on the area selected for analysis, this focus can be general and concrete almost at the same time. One could call this modality a visual equivalent of the historic present and, within the given framework, a technique of foregrounding economic events and relations. Indeed, there is a ‘Laocoonian’ aspect to this neoclassical combination of timelessness, visuality and economics. Concurrently, the nodal topology and the market represented assume a physicality and an immediate presence. Thus, the visual representation helps to convey the idea of economy’s autonomic and timeless realm.117 Thereby, sliding along edges in a virtual topology performs the idea of an open market where people, goods, services and capital circulate freely. This unimpeded movement of potential research objects in this representation is one factor that enacts the economy’s dynamic growth. At least as important is the gaze of the beholder with its ubiquity. Depending on the resolution or zoom capabilities, every node and relation can be observed thoroughly. Thus, the visual examination is delivered like an immediate satisfaction of present wants. While this visualization operates as an argument in favour of a mainstream economic model,118 a reverse transfer between economics and visualization takes place as well. Thereby, the autonomy and timelessness of the economic model reinforces the understanding of visualization as a prosthetic technology. This happens when the network representation leads to the impression of an adequate visualization of economic matters. This ‘abstract realism’, in turn, supports the claim of big data’s visual and epistemological potential. Art market visualizations, thus, operate as symbolic machines that generate economic and visual productivity. Mutually reinforcing, visual observation and economic efficiency conjoin with the idea of abundant knowledge. In other words, the network represented operates as the visual allegory of an economic promise.
To a significant degree, here we are dealing with a production of self-evidence that relies on the demonstration of its scientific nature. In the given context, this means underlining the importance of technology. In data visualization, zooming ensures controllable and observable “contractions and expansions”119 of “granular information”120. This allows for a smooth transition from micro- to macrolevel. Drawing the power of persuasion (energeia) from the vividness (enargeia) of its representation, zooming proves to be a core technique of visual rhetoric.121 Consequently, zooming stages singular frames of ‘quality data’122 and highlights its technical and laboratory-like capacities. The increase and decrease of resolution appear as the visual equivalent of “compression or dilatation”123 in experimental epistemic machines, as analyzed by Hans-Jörg Rheinberger. It is a most fundamental technique full of “slow-downs and speed-ups in order to bring the investigated phenomena into the realm of the visible.”124 In terms of an analogy, one might think of the recommendations formulated by Ben Shneiderman for data visualization: “Overview first, zoom and filter, then details on demand.”125 With a zoom capability at hand, thus, the viewer feels empowered by an ostentatiously scientific tool that allows one to get the visual results she or he demands. As a social equivalent to zooming, data visualizations are aimed at “scaling up [projects] to be shared with others.”126 Here, standardization is mandatory as in, for example, the adjustment of names to “those already in use by library and museum professionals [...].”127 Ultimately, it is about the dream of “a single narrative of phase transitions from the big bang to our own daily experience.”128 Even if this vision is still far off, that crossing of boundaries between the sciences and humanities, between technology, economics, and art reproduces that narrative of technical omnipotence.
Visualizations, narrativizations, and other devices are mutually supportive in managing processes of scientification and objectification.129 According to Olav Velthuis, the art economy relies on narrativization.130 The same holds true for financial markets as highlighted by Karin Knorr Cetina and Werner Reichmann: “Financial analysts and economists [...] produce [...] short financial stories, that they do not simply extract from their data but construct as plausible fiction often after chatting things through with contacts and colleagues [...].”131 In a similar way, Maximilian Schich brings the narrative of quantification into play when he compares the “less than 160,000 artworks“ of the Paris salon with pictures of the “more than 350 million pictures [...] uploaded by Facebook users every single day.” 132 This weakening of terminological and conceptual precision in the equation of artworks and pictures follows a specific rhetoric. It is grounded in data visualization’s objective of establishing commensurability. Because of today’s dominance of “mathematical modelling in economy”133 this translation is mostly conducted in the “lingua franca of arithmetics”134.
However, this arithmetic language is not necessarily as objective as it might seem. Used in specific contexts, it has its own way of underlying communication with particular semantics. The aforementioned correlation of artworks and pictures, for example, should not be misunderstood as a complete disregard of traditional artistic production. Last but not least, under specific conditions, the comparison leaves open the possibility that artistic production could rise to hitherto unimagined heights. Just imagining that hundreds of thousands of images could become trillions imparts the comparison with an aura of the sublime. Thus, with the help of quantification and contemporary technology, the Paris salon and its art-historical paradigms come into reach. An era of great art, scandals, and cultural values is destined to return on an even greater scale. This Renaissance connotation of bringing back and perfecting art is part of the comparison’s implicit rhetoric. Based on its scientific aura, this arithmetic example not only promises but almost predicts art and human creativity to rise. In order to harvest the riches, though, quantification methods shall be consistently applied. This short tale of raising prosperity is imbued with an abundance of artistic and theoretical potential. However, they will be open only to those who know how to unlock them.
While representing data, art market visualizations also reproduce big data’s epistemological grounds and strategic alignment.135 As shown before, research tools can acquire semantics of their own. This does not mean, however, that the use of symbolic techniques like visualizations is the very same in every context, that research and commerce, for example, completely merge into each other just because they both operate with big data.136 However, in the given context where the financialization of the art market is closely connected to symbolic machines also used in research it seems worth asking about the implications.137 Companies like Reuters, for example, fostered a discourse on “transparency in the financial markets”138 which eventually led to art price services like Artnet providing elaborate art market data.139 Virtually symptomatic, with the acquisition of Eugene Garfield’s Institute for Scientific Information Reuters also became very active in scientometrics, the quantification of research performance. This interweavement of academia and commerce provokes questions of epistemological relevance. Therefore, one should ask to what extent art market visualizations enact the visual performative of a “scientification of art investment”140 with its far-reaching connotations. Similar to technology’s meta-technological drive, for example, art market visualizations highlight their epistemological and governmental interdependence with the economy.
In this context, some important issues remain unsolved. Among the better-known problems are questions regarding access to private data and data privacy as well as copyright and ownership issues.141 This includes the question of having “enough data”142 or access to private data as a necessary prerequisite for publications and research positions.143 Other important issues are long-term storage and reproductibility.144 While complicated enough, however, it’s not only about costs and social dependency. It affects the way recognition and the possibility of new findings are conceptualized and, more general, how the production and distribution of knowledge is organized. Recognizing patterns in art market networks seems analogous to “the study of potential correlations with other investments.”145 If one follows Maximilian Schich, this mingling of the researcher’s and trader’s perspective seems to come down to a financialization of scientific productivity: “Hedging our resources like an angel investor or venture capitalist, with collaborators being involved in multiple projects, we can minimize the risk and ensure the overall success of a given group of researchers.”146 It remains to be seen, to what extent such a glorification of stock exchange speculation will become a prerequisite for knowledge production. Beyond the non-trivial question of research funding, though, more far-reaching questions of geopolitical relevance are related to it. Quite often, big data’s dispersion into various areas of life and research is accompanied by an Enlightenment rhetoric that seems to ignore its dialectic completely. “These services [like Artnet – TS] can be seen to have democratized, rationalized, or even ‘purified’ the art market, just as they have done in other financial markets.”147 Basically, this description by Olav Velthuis and Erica Coslor reproduces the narrative of a free market economy contributing to peace and prosperity. While enabling more efficient economic transactions could be regarded as a value in itself, this statement asserts more than that. The reference to democracy invokes the history of capital’s global spreading and the cultural techniques applied in order to facilitate these movements. It is not too far-fetched in this context to think of early modern quantification, cartography, and navigation and, thus, of The Ambassadors as well.
By establishing a “relationship between recognition by art institutions [...] and the financial value”, the contemporary art world’s hierarchy is also reproduced by media like the Kunstkompass and, last but not least, its visualization techniques.148 Although there exist particular differences between lists, graphs, networks and other forms of data representation, they share – depending on the context and quality – a similar degree of visual necessity. In art market research, therefore, network representations can rely on established experiences with lists.149 According to Alan Quemin, this hierarchy of the art world consists of only a few leading countries, mostly from Western Europe and North America.150 However, as shown by Joyeux-Prunel and others, recent art market research convincingly started to question the periphery’s subservient role as a mere importer of central values.151 Nonetheless, it remains to be seen what “propos[ing] explanations about larger trends in the art business and trade, not only from a European perspective but also on those extending across the Atlantic”152, will mean in the future. For example, will it include any significant departure from hierarchical models and will it propose a post-colonial criticism of contemporary Euro- and Western-centrist perspectives? Thinking of the digital divide, it remains to be seen if well-intentioned endeavours in the digital humanities, as for example envisioned by Thomas W. Gaehtgens, “will overcome the barriers of national traditions and lead to an environment of scholarly openness that respects the existence of multiple ‘art histories’.”153 The decision about the what and when of openness will remain a question of power, structural rather than personal and connected to a variety of factors mostly beyond any individual scope. If anything, therefore, the globalization associated with big data and its utopian idea of a “human collective intelligence”154 seems to be moving, as stressed by Florian Cramer, towards a “mutation into new power structures, less obvious but no less pervasive, which [...] continue to govern geopolitics and global production chains.”155 Most interestingly, the performative quality of the symbolic operations underlying these processes and, basically, enabling them is mostly neglected. As Alan Quemin points out, “it is not a question of deliberate power, exercised in a cynical manner, but rather the consequence of a mechanism which allows market actors and institutions to carry out their respective roles while relying on a strong territorial dimension which is both denied and largely unconscious.”156 Once again, it comes to mind that anamorphosis’ technology of distortion was part of a practical geometry used for navigation, trade, and military endeavours.157 Similarly, today’s “[i]nteractive interfaces [...] stem from military projects [...].”158 Today cartography’s governmental legacy, as analyzed by John B. Harley, produces comparable effects. Thus, data’s techno-cultural history facilitates a similar “juridical territory” characterized by “surveillance and control.”159 As mentioned before, it is important to keep in mind the possible differences between the usage of visualizations in science, commerce, and politics with their own systemic logics. At the same time, however, there is a close relationship between these factors that should be thought of as well. At least, there is transfer and transformation on the level of ideology and discursive mechanisms. Indeed, because of the close relationship of finance and the arts, the financial market’s territorialization seems to affect the art world’s geographical concentration. In fact, the world’s financial hubs such as New York, London, Zurich, or Tokyo are located in the same places that are the main centres of the art market.160 Apparently, art market’s dominant structure points to a financialized politics of recognition.161 Without a post-data critique, contemporary art market research reproduces this position of epistemological sovereignty.
A popular image of the financial market is that it is in a constant state of flux. Like a river, it seems to flow from one continent to the other. Aligning with this metaphor of naturalization and thus demonstrating how economic processes converge with normality and natural vision is the suggestion by Karin Knorr Cetina and Werner Reichmann “that the ongoing stream of transactions shows up and becomes intensified in the three major time zones ‘with the sun’[...].”162 This solarization of economic processes, however, should not distract from the fundamental role that invisibility also plays on both financial and art markets. According to Knorr Cetina and Reichmann, this allegedly continuous movement is facilitated by “summary accounts [...] [including] closing rates, index values, volume statistics, intraday trading indicators, and so on.”163 Every transaction “cut[s] the ties”164 between contexts, actors, and things. Additionally, there are “episodes of data stoppage and refusal”165 when actors turn to face-to-face-communication. Thus, the constant rewriting of the market is permeated by moments of hesitation and intransparency.
These blind spots are crucial, though, as Liran Einav and Jonathan Levin write: “The essence of the market is the ‘delay’ that allows for the present anticipation of future transactions, translating these into gains or losses.”166 These vacillations and delays in the market are analogous to some phenomena already discussed. These market contingencies are comparable to data cleaning where “[r]eliability is linked to deletion”167 as well as to the “paradoxical combination of visibility and invisibility, of rational causality and profound ignorance, [that] grounds the computer as an attractive model for the ‘real’ world.”168 Another striking aspect does not lie in the correctness of their analysis and predictions (they remain uncertain).169 Instead, it can be found in the performativity of their usage as emphasized by Elena Esposito: “The relevant information is not that which is contained in the model, but that which is provided by its use and then used to decide (often differently from what the model would have predicted).”170 Thus, a deliberate deviation from textbook knowledge is necessary, a deviation whose visual equivalent would be anamorphotic distortion. An anagnorisis that pushes recognition beyond a mere reproduction of well-known facts would come close to that idea as well. In many ways, therefore, data visualization is linked to expected unexpected processes and results.
While “[u]ncertainty remains the fundamental resource of economic behavior”,171 as emphasized by Esposito, the line between unpredictability, on the one hand, and desperation and panic, on the other, seems to remain rather thin. In order to fulfill its stimulating function, uncertainty has to stay within predictable limits. Moreover, it has to be reproduced and communicated in an appropriate way. This suggests an advanced understanding of those anagnoristic moments – one that moves beyond the problematic aspects described above.172 According to this interpretation, they interweave the rupture of statistical anomalies with the promise of smooth continuation. With regard to their probabilistic nature, unexpected results produce a rhythm and clocking. In doing so, they establish a time-line that allows to string together previously disparate phenomena into a coherent structure, a narrative that transforms stochastic episodes into causal relations of chapters. At least, that is one option. In any case, art market visualizations point to relevant economic interrelations beyond the merely visual, to possibly obscure aspects, however, that can also be essential to visual, discursive, and numerical processes. Thus, visualizations can also reveal rather unexpected epistemic, aesthetic and poetic layers. In particular, this refers to the topos of intransparency.
Future research will not only have to deal with the question of how to visualize uncertainty and inconsistency. At least as important is a change in the notion of the alleged intransparency of art markets. It should be detached from its neoclassical anchoring and be seen in relation to general economic “variability and inconstancy.”173 Here, the potential of data visualization as a tool of critique is still largely unexploited.
Last but not least, that rhythmization of economic processes with visual means points to recent developments in the reconstruction of soundscapes.174 Perhaps, one of big data’s next developments in art market studies will be the reconstruction of synaesthetic experiences in art trade, the soundscape of a trade-shop, a gallery, or an auction house. Most likely, that would increase data’s epistemological as well as governmental capacities. Then again, it could point to research beyond sound – at least, as long as it remains unexpected and exciting.
Thomas Skowronek studied Slavic Studies and History in Marburg, Moscow and Berlin and completed his doctoral thesis on the representational strategies and the discursive order of art markets in 2013.
1 John B. Harley, Deconstructing the Map, in Martin Dodge, Rob Kitchin and Chris Perkins, eds., The Map Reader: Theories of Mapping Practice and Cartographic Representation (Chichester: Wiley-Blackwell, 2011), 56-64, 58. I am very grateful to the reviewer of this article for his or her critical and helpful remarks on an earlier draft of this paper. In particular, for the reference: Daniel Allington, Sarah Brouillette, and David Golumbia. 2016. Neoliberal Tools (and Archives): A Political History of Digital Humanities, in Los Angeles Review of Books (accessed on 1 May 2016), https://lareviewofbooks.org/article/neoliberal-tools-archives-political-history-digital-humanities/ (30.05.2017).
2 Pamela Fletcher and Anne Helmreich, Local/Global: Mapping Nineteenth-Century London‘s Art Market, in Nineteenth-Century Art Worldwide, 11/3 (2012), 1-42, 19.
3 Béatrice Joyeux-Prunel, Catherine Dossin, and Sorin Adam Matei, Spatial (Digital) History: A Total Art History? – The Artl@s Project, in Visual Resources, 29/1-2 (2013), 47-58, 55.
4 Manuel Lima, Visual Complexity. Mapping Patterns of Information (New York: Princeton Architectural Press, 2011), 80.
5 Lev Manovich, Data Science and Digital Art History, in Digital Art History 1(2015), 12-35, 29.
6 W. J. T. Mitchell, Picture Theory: Essays on Verbal and Visual Representation (Chicago: University of Chicago Press, 1994), 16.
7 Cf. Michel Foucault, Governmentality (a lecture given on 1 Febuary 1978), in Michel Foucault, Security, Territory, Population: Lectures at the College De France, 1977-78 (London, Palgrave-MacMillan, 2007), 126-145, 88, 99, 104, and 108.
8 Sybille Krämer, ‘Operationsraum Schrift’: Über einen Perspektivenwechsel in der Betrachtung der Schrift, in Gernot Grube, Werner Kogge, and Sybille Krämer, eds., Schrift. Kulturtechnik zwischen Auge, Hand und Maschine (München: Fink, 2005), 23-57, 31f. All translations by the author unless otherwise stated.
9 Cf. Kyung-Ho Cha and Markus Rautzenberg, Einleitung: Im Theater des Sehens. Anamorphose als Bild und philosophische Metapher, in Kyung-Ho Cha and Markus Rautzenberg, eds., Der entstellte Blick. Anamorphosen in Kunst, Literatur und Philosophie (München: Fink, 2008), 7-22, 11.
10 Cf. Philipp F. Kennedy and Marilyn Lawrence, Introduction, Philipp F. Kennedy and Marilyn Lawrence, eds., Recognition: The Poetics of Narrative. Interdisciplinary Studies on Anagnorisis (New York: Lang, 2009), 1-12, 3.
11 Karin Knorr Cetina, Epistemic Cultures. How the Sciences Make Knowledge (Cambridge: Harvard University Press, 1999), 3.
12 Cf. Thomas W. Gaehtgens, Thoughts on the Digital Future of the Humanities and Art History, in Visual Resources, 29/1-2 (2013), 22-25, 23.
13 This formulation refers to a classical lecture by John L. Austin, How to do things with words. Second Edition. Edited by J. O. Urson and Marina Sbisà (Harvard: University Press, 1975). However, the following article regards the institutional context responsible for the success of speech acts as affected by desires and inconsistencies.
14 Cf. Victoria Szabo, Transforming Art History Research with Database Analytics: Visualizing Art Markets, in Art Documentation: Journal of the Art Libraries Society of North America, 31/2 (2012), 158-175, 171.
15 Cf. Szabo, Transforming Art History Research, 162.
16 Cf. Szabo, Transforming Art History Research, 168.
17 Cf. Szabo, Transforming Art History Research, 167.
18 Hans-Jörg Rheinberger, Infra-Experimentality: From Traces to Data, from Data to Patterning Facts, in History of Science, 49/3 (2011), 337-348, 345f.
19 Bruno Latour, Drawing Things Together, in Martin Dodge, Rob Kitchin and Chris Perkins, eds., The Map Reader, 65-72, 66.
20 Szabo, Transforming Art History Research, 171.
21 Szabo, Transforming Art History Research, 171.
22 Drucker, Johanna: Humanities Approaches to Graphical Display, in Digital Humanities Quarterly, 5/1 (2011), http://www.digitalhumanities.org/dhq/vol/5/1/000091/000091.html, accessed on 30 March 2017.
23 Sophie Raux, Visualizing Spaces, Flows, Agents, and Networks of the Art Markets in the 18th Century: Some Methodological Challenges, in Artl@s Bulletin, 2/2 (2013), Article 4, 26-37, 34.
24 Cf. Lauren Klein, The Image of Absence: Archival Silence, Data Visualization, and James Hemings, in American Literature, 85/4 (2013), 661-688, 665.
25 Diane M. Zorich, Transitioning to a Digital World. Art History, Its Research Centers, and Digital Scholarship, Samuel H. Kress Foundation, May 2012, http://www.kressfoundation.org/uploadedFiles/Sponsored_Research/Research/Zorich_TransitioningDigitalWorld.pdf, accessed on 30 March 2017.
26 Cf. Anna Bentkowska-Kafel, Debating Digital Art History, in Digital Art History, 1 (2015), 51-64, 59; Gaehtgens, Thoughts on the Digital Future, 24; Marcel Lepper, Big Data, Global Villages, in Philological Encounters, 1 (2016), 131-162, 149.
27 Cf. Linnet Taylor, Ralph Schroeder, and Eric Meyer, Emerging practices and perspectives on Big Data analysis in economics: Bigger and better or more of the same?, in Big Data & Society, July–December (2014) 1–10. doi: 10.1177/2053951714536877, 2-4; Liran Einav and Jonathan Levin, The Data Revolution and Economic Analysis, in Innovation Policy and the Economy, 14 (2014), 1-28. doi: 10.3386/w19035, 13; Rob Kitchin, Big Data, new epistemologies and paradigm shifts, in Big Data & Society, April–June (2014), 1–12. doi: 10.1177/2053951714528481, 5.
28 Cf. Louise Amoore and Volha Piotukh, Life beyond big data: governing with little analytics, in Economy and Society, 44/3 (2015), 341-366. doi: 10.1080/03085147.2015.1043793, 344.
29 Cf. Wendy Hui Kyong Chun, Programmed Visions: Software and Memory (Cambridge, Massachusetts: The MIT Press, 2014), 9.
30 Franco Moretti, Distant Reading (London: Verso, 2013), 49.
31 Lev Manovich, Cultural Analytics: Visualizing Cultural Patterns in the Era of “More Media”, manovich.net,http://manovich.net/content/04-projects/063-cultural-analytics-visualizing-cultural-patterns/60_article_2009.pdf, accessed on 30 March 2017.
32 Szabo, Transforming Art History Research, 159.
33 Maximilian Schich, Figuring out Art History, in Digital Art History, 2 (2016), 40-67, 45.
34 Lima, Visual Complexity, 61.
35 Cf. Marcus Burkhardt, Digitale Datenbanken. Eine Medientheorie im Zeitalter von Big Data (Bielefeld: transcript, 2015), 150 and 333.
36 Joyeux-Prunel, Dossin, and Matei, Spatial (Digital) History, 51.
37 Fletcher and Helmreich, Local/Global, 22.
38 Szabo, Transforming Art History Research, 164. Szabo refers to Sandra van Ginhoven, Connecting art markets. Guilliam Forchondt’s dealership in Antwerp (c. 1632-78) and the overseas paintings trade (Leiden: Brill, 2016).
39 Cf. K. Bender, From Spreadsheet to Network Analysis of Art Historical Data, Part II: Visualizing with PALLADIO and measuring connectivity and dispersion (accessed on 20 November 2015), http://kbender.blogspot.de/2015/11/from-spreadsheet-to-network-analysis-of.html (accessed on 31 May 2017).
40 Cf. Christoph Asendorf, Super Constellation. Flugzeug und Raumrevolution. Die Wirkung der Luftfahrt auf Kunst und Kultur der Moderne (Wien: Springer, 1997), 49-82 and 154-156.
41 Cf. Hubertus Gaßner, Utopisches im russischen Konstruktivismus, in: Hubertus Gaßner, Karlheinz Kopanski, and Karin Stengel, eds., Die Konstruktion der Utopie. Ästhetische Avantgarde und politische Utopie in den 20er Jahren (Marburg: Jonas Verlag, 1992), 48-68, 53f.
42 For now, it is of secondary relevance if this happens explicitly or implicitly. What seems more important, though, is the question of possible political and economic implications of these processes. In the further course, this article presents a commentary of its own on these neo avant-gardist developments.
43 Cf. Stefka Hristova, Images as Data: Cultural Analytics and Aby Warburg’s Mnemosyne, in Digital Art History, 2 (2016), 116-133, and Schich, Figuring out Art History, 46.
44 Kitchin, Big Data, new epistemologies and paradigm shifts, 2. For a classic definition cf. Doub Laney, 3-D Data Management: Controlling Data Volume, Velocity and Variety, in META Group, 06.02.2001, http://blogs.gartner.com/doug-laney/files/2012/01/ad949-3D-Data-Management-Controlling-Data-Volume-Velocity-and-Variety.pdf (…) and Seth Grimes, Big Data: Avoid ‘Wanna V’ Confusion; http://www.informationweek.com/big-data/big-data-analytics/big-data-avoid-wanna-v-confusion/d/d-id/1111077, accessed on 30 March 2017.
45 Rheinberger, Infra-Experimentality, 340.
46 Cf. Kitchin, Big Data, new epistemologies and paradigm shifts, 5.
47 Kitchin, Big Data, new epistemologies and paradigm shifts, 4.
48 Drucker, Humanities Approaches.
49 Cf. Roland Barthes, Mythen des Alltags (Frankfurt/Main: Suhrkamp 1964), 112f.
50 Cf. Schich: Figuring out Art History, 45.
51 Cf. Johannes Angermüller, Wissenschaft zählen. Regieren im digitalen Panoptikum, in Leon Hempel, Susanne Krasmann, and Ulrich Bröckling, eds., Sichtbarkeitsregime. Überwachung, Sicherheit und Privatheit im 21. Jahrhundert (Wiesbaden: VS, 2010), 174-190, 174.
52 Hans Belting, Die Herausforderung der Bilder. Ein Plädoyer und eine Einführung, in Hans Belting, ed., Bilderfragen. Die Bildwissenschaften im Aufbruch (München: Fink, 2007), 11-23, 18.
53 Cf. Cha and Rautzenberg, Einleitung, 13.
54 Cha and Rautzenberg, Einleitung, 8.
55 Cf. Cha and Rautzenberg, Einleitung, 8.
56 Cf. Daniela Roberts, “Imago Mundi”. Eine ikonographische und mentalitätsgeschichtliche Studie, ausgehend von Hans Holbein d. J. “The Ambassadors” (Hildesheim: Olms, 2009), 211 and 218.
57 Cha and Rautzenberg, Einleitung, 7f.
58 Cf. Cha and Rautzenberg, Einleitung, 12.
59 With anamorphosis, Leibniz associated a transcendental position beyond the contingencies of human perception: “Zwar können wir solche Ordnung nicht sehen, weilen wir nicht in dem rechten Gesicht-Punkt stehen, gleichwie ein prospectivisch Gemählde nur aus gewissen Stellen am besten zu erkennen, von der Seite aber sich nicht recht zeigen kann. Allein wir müssen uns mit den Augen des Verstandes dahin stellen, wo wir mit den Augen des Leibes nicht stehen, noch stehn können.” Gottfried Wilhelm Leibniz, Von dem Verhängnisse, in Gottfried Wilhelm Leibniz, Philosophische Werke in vier Bänden, ii: Hauptschriften zur Grundlegung der Philosophie II, ed. Ernst Cassirer (Hamburg: Felix Meiner, 1996), 337-342, 339.
60 Liran Einav and Jonathan Levin, Economics in the age of big data, in Science, 346:6210 (2014), 715-721. doi: DOI: 10.1126/science.1243089, 721. Cf. Amoore and Piotukh, Life beyond big data, 361.
61 Isabel Meirelles, Maximilian Schich, and Roger Malina, Arts and Humanities, Complex Network Analysis of, in Reda Alhajj and Jon Rokne, eds., Encyclopedia of Social Network Analysis and Mining (New York: Springer, 2014), 56-60, 59.
62 Later, when speaking about market dynamism a similar gap will be of relevance.
63 Chun, Programmed Visions, 17.
64 Cf. Wolfgang Coy, Die Konstruktion technischer Bilder – eine Einheit von Bild, Schrift und Zahl, in Sybille Krämer and Horst Bredekamp, eds., Bild, Schrift, Zahl (München: Fink, 2009), 143-153, 152.
65 Cf. Wolfgang Schäffner, Instrumente und Bilder. Anamorphotische Geometrie im 16. und 17. Jahrhundert, in Helmar Schram, ed., Bühnen des Wissens. Interferenzen zwischen Wissenschaft und Kunst (Berlin: University Press, 2003), 92-109, 94. From a deconstructive perspective, anamorphosis could be regarded as the suppressed visual other of central perspective’s claim for visual normalization.
66 Amoore and Piotukh, Life beyond big data, 344.
67 Alexander R. Galloway, The Interface Effect (Cambridge: Polity Press, 2012), 82.
68 Bettina Heintz, Numerical Difference. Toward a Sociology of (Quantitative) Comparisons, in Zeitschrift für Soziologie, 39/3 (2010), 162–181, 163, 171 and 177.
69 Cf. Jefferson Bailey and Lily Pregill, Speak to the Eyes: The History and Practice of Information Visualization, in Art Documentation, 33/2 (2014), 168-191, 191.
70 Cf. Joanna Drucker, Humanistic Theory and Digital Scholarship, in Matthew K. Gold, ed., Debates in the digital humanities (Minnesota: University Press, 2012), 85-98, 89.
71 Erica Coslor, Transparency in an opaque market: Evaluative frictions between “thick” valuation and “thin” price data in the art market, in Accounting, Organizations and Society, 50 (2016), 13-26, 18.
72 Alfred W. Crosby, The Measure of Reality. Quantification and Western society, 1250-1600 (Cambridge: University Press, 1997), 228f.
73 Cf. Barthes, Mythen des Alltags, 112f.
74 Cf. Roberts, “Imago Mundi“, 245.
75 Martin Jay, Scopic regimes of modernity, in Hal Foster, ed., Vision and Visuality (Seattle: Bay Press, 1988), 2-23, 3.
76 Cf. Dieter Mersch, Abbild und Zerrbild. Zur Konstruktion von Rationalität und Irrationalität in frühneuzeitlichen Darstellungsweisen, in Helmar Schramm, Ludger Schwarte, and Jan Lazardzig, eds., Kunst und Wissenschaft. Zur Architektonik kultureller Grenzen im 17. Jahrhundert (Berlin: Walter de Gruyter, 2008), 21-40, 25.
77 Lyle Massey, Anamorphosis through Descartes or perspective gone awry, in Renaissance Quarterly, 50/4 (1997), 1148-1189, 1186.
78 Fletcher and Helmreich, Local/Global, 19.
79 On the relation of visuality and anagnorisis in antiquity cf. Michael Erler, Anagnorisis in Tragödie und Philosophie. Eine Anmerkung zu Platons Dialog ‘Politikos’, in Würzburger Jahrbücher für die Altertumswissenschaften, 18 (1992), 147-170, 167; Emma Buckley, Visualising Venus: epiphany and anagnorisis in Valerius Flaccus’ Argonautica, in Helen Lovatt and Caroline Vout, eds., Epic Visions. Visuality in Greek and Latin Epic and its Reception (Cambridge: University Press, 2013), 78-98, 97f.
80 Philipp F. Kennedy and Marilyn Lawrence, Introduction, in Philipp F. Kennedy and Marilyn Lawrence, eds., Recognition: The Poetics of Narrative. Interdisciplinary Studies on Anagnorisis (New York: Peter Lang, 2009), 1-12, 1.
81 Aristotle, Poetics, ed. and trans. Gerald F. Else (Ann Arbor: University of Michigan Press, 1970), 1452a29-32.
82 Cf. Erler, Anagnorisis in Tragödie und Philosophie, 168 and 170.
83 Cf. Hayden White, Metahistory: The Historical Imagination in Nineteenth-century Europe (Baltimore/ London: Johns Hopkins University Press, 1973).
84 Cf. Olav Velthuis, Talking Prices, Contemporary Art, Commercial Galleries, and the Construction of Value (Princeton: University Press, 2005).
85 Deirdre N. McCloskey, The Rhetoric of Economics (Madison: The University of Wisconsin Press, 1998), 135, and Deirdre N. McCloskey and Stephen T. Ziliak, Signifying nothing: Reply to Hoover and Siegler, in Journal of Economic Methodology, 15/1 (2008), 39-55, 45f.
86 Olaf Rippe, Dramatische Aufklärung. Anagnorisis und Motive der (Selbst-)Erkenntnis in Tragödien des 18. Jahrhunderts (Marburg: Tectum Verlag, 2009), 251.
87 Vgl. Rippe, Dramatische Aufklärung, 19.
88 Massey, Anamorphosis through Descartes, 1186.
89 Chun, Programmed Visions, 18.
90 Krämer, ‘Operationsraum Schrift’, 31f.
91 Massey, Anamorphosis through Descartes, 1186. Interestingly, when introduced by the church fathers the term anamorphosis was used to describe the rebirth of man in baptism. Cf. Cha and Rautzenberg, Einleitung, 8.
92 Cha and Rautzenberg, Einleitung, 17.
93 Cf. Rippe, Dramatische Aufklärung, 253.
94 Cf. Talal Asad, Formations of the Secular. Christianity, Islam, Modernity (Stanford: University Press, 2003), 73-79.
95 Latour, Drawing Things Together, 68.
96 Dirk Helbing, Globally networked risks and how to respond, in Nature, 497/2 (2013), 51-59, 51; Hal R. Varian, Big Data: New Tricks for Econometrics, in Journal of Economic Perspectives, 28/2 (2014), 3–28, 24.
97 Terence Cave, Recognitions. A Study in Poetics (Oxford: Clarendon, 1988), 489.
98 Cf., for example, van Ginhoven, Connecting art markets.
99 Szabo, Transforming Art History Research, 164.
100 Cf. Lisa Parks, Drones, Infrared Imagery, and Body Heat, in International Journal of Communication 8 (2014), Feature 2518–2521, 2519.
101 Galloway, The Interface Effect, 83.
102 Cf. Leo Breiman, [Statistical Modeling: The Two Cultures]: Rejoinder, in Statistical Science, 16/3 (2001), 226-231, 231; D. R. Cox, [Statistical Modeling: The Two Cultures]: Comment, in Statistical Science, 16/3 (2001), 216-218, 216f.
103 Galloway, The Interface Effect, 83.
104 Doug Laney, 3-D Data Management.
105 Cf. Murtha Barca and Anne Helmreich, Introducing Three Digital Art History Case Studies (05.02.2017), http://blogs.getty.edu/iris/dah_baca_helmreich/ (accessed on 31 May 2017).
106 Lima, Visual Complexity, 79f. On the political subtext cf. Cahndra-Milena Danielzik and Daniel Bendix, entdecken / Entdeckung /Entdecker_in / Entdeckungsreise, in Susan Arndt and Nadja Ofuaty-Alazard, eds., Wie Rassismus aus Wörtern spricht. (K)Erben des Kolonialismus im Wissensarchiv deutsche Sprache. Ein kritisches Nachschlagewerk (Münster: Unrast Verlag, 2015), 264-269.
107 Harley, Deconstructing the Map, 59.
108 Cf. Benjamin D. Hennig, Rediscovering the World. Map Transformations of Human and Physical Space (Berlin: Springer, 2013), 34; Jakob Tanner, Wirtschaftskurven. Zur Visualisierung des anonymen Marktes, in David Gugerli and Barbara Orland, eds., Ganz normale Bilder. Historische Beiträge zur visuellen Herstellung von Selbstverständlichkeit (Zürich: Chronos, 2002), 129-158, 143. The rise of quantification underlying these developments, quite similar, is a process extending back to the rise of mathematics in early modern times.Cf. Burkhardt, Digitale Datenbanken, 341f.; Lepper, Big Data, Global Villages, 148.
109 Cf. Olav Velthuis and Erica Coslor, The Financialization of Art, in Karin Knorr Cetina and Alex Preda, eds., The Oxford Handbook of the Sociology of Finance (Oxford: University Press, 2012), 470- 487.
110 Timothy Mitchell, Fixing the Economy, in: Cultural Studies, 12/1 (1998), 82-101, 92.
111 Mitchell, Fixing the Economy, 90.
112 Cf. Tanner, Wirtschaftskurve, 143
113 Tanner, Wirtschaftskurve, 143.
114 Cf. Barthes, Mythen des Alltags.
115 This argument is not meant to neglect any natural conditionality of perception, in the sense of physical or biological influence, for example. However, notions about nature are always culturally mediated.
116 Cf. Schiller, Friedrich, Über die ästhetische Erziehung des Menschen in einer Reihe von Briefen (Stuttgart: Reclam, 2012), Brief 13 and 27.
117 Cf. Randall Bausor, Time and Equilibrium, in Philip Mirowski, ed., The Reconstruction of Economics (Boston: Kluwer-Nijhoff, 1986), 93-135, 98-101 and 105. A comparability with the aforementioned example about the economy’s seemingly natural growth potential consists insofar as the reference here is to nature as a system with its own rules (natural law) and the implicit statement that the economy is guided by similar universal principles.
118 Cf. Tony Lawson, What is this ‘school’ called neoclassical economics?, in Jamie Morgen, ed., What is Neoclassical Economics? Debating the origins, meaning, and significance (London: Routledge, 2016), 30-80, 63f.
119 Hans-Jörg Rheinberger, Making Visible. Visualization in the Sciences – and in Exhibitions?, in Susanne Lehmann-Brauns, Christian Sichau and Helmuth Trischler, eds., Preprint, 399 (2010), The Exhibition as Product and Generator of Scholarship, https://www.mpiwg-berlin.mpg.de/Preprints/P399.PDF, accessed on 30 March 2017, 9-23, 10.
120 Schich, Figuring out Art History, 51.
121 Cf. Heinrich F. Plett, Enargeia in Classical Antiquity and the Early Modern Age. The Aesthetics of Evidence (Leiden: Brill, 2012), 13, 86f. and 196f.
122 Quality comes into play when there are “local deviations from the uncovered general patterns.” Maximilian Schich, Chaoming Song, Yong-Yeol Ahn, Alexander Mirsky, Mauro Martino, Albert-László Barabási, and Dirk Helbing, A network framework of cultural history, in Science, 345/6196 (2014), 558-562, 558.
123 Rheinberger, Making Visible, 10.
124 Rheinberger, Making Visible, 10.
125 Ben Shneiderman, The Eyes Have It: A Task by Data Type Taxonomy for Information Visualizations, in Proceedings 1996 IEEE Symposium on Visual Languages, (Boulder, 1996), 336-343, 337.
126 Szabo, Transforming Art History Research, 163.
127 Szabo, Transforming Art History Research, 167.
128 Schich: Figuring out Art History, 46.
129 Cf. Tanner, Wirtschaftskurven, 131.
130 Cf. Olav Velthuis, Talking Prices.
131 Karin Knorr Cetina and Werner Reichmann, Living Data in Financial Markets. Concepts and Consequences, in Florian Süssenguth, ed., Die Gesellschaft der Daten. Über die digitale Transformation der sozialen Ordnung (Bielefeld: transcript, 2015), 147-172, 150.
132 Schich: Figuring out Art History, 45.
133 Lawson, What is this ‘school’ called neoclassical economics?, 32.
134 Angermüller, Wissenschaft zählen, 176.
135 Cf. Daniel Allington, Sarah Brouillette, and David Golumbia, Neoliberal Tools (and Archives).
136 Telling, though, is Alan Jacobs attempt at refuting Digital Humanity’s possibly far-reaching interdependence with commercial interests and ideologies by referring to the common practice of juridical text interpretation for international corporations merely as coincidence between a practice of knowledge and business issues. While there, certainly, is not need to prevent any legal or hermeneutical education, possible overlaps and their implications should be considered. While the legal contract is a core social institution, it should be noted, that it is the commercial contract that is on the verge of becoming a model for all contractual operations or even all social behaviour. This contractual coordination, in turn, is embedded into cost-benefit consideration that submits this process chain to a permanent economic evaluation. Cf. Jacobs, Alan, Critiquing the Critique of Digital Humanities, 02.05.2016, in Text Patterns, http://text-patterns.thenewatlantis.com/2016/05/critiquing-critique-of-digital.html, accessed on 31 May 2017; Ulrich Bröckling, Das unternehmerische Selbst. Soziologie einer Subjektivierungsform (Frankfurt/Main: Suhrkamp, 2007), 133-155.
137 And neglecting this rather unexplored side is a research-policy related decision or, at least, a collateral setting of research agendas that participate in the reproduction of social relationships. However, most telling connections between politics and science in the nineteenth century can be observed in the field the humanities. Cf. Wellmon, Chad, Big Humanities, 27.05.2014, in The Hedgehog Review, http://iasc-culture.org/THR/channels/Infernal_Machine/2014/05/big-humanities/, accessed on 30 May 2017.
138 Velthuis and Coslor, The Financialization of Art, 476.
139 Erica Coslor and Christophe Spaenjers, Organizational and epistemic change: The growth of the art investment field, in Accounting, Organizations and Society, 55 (2016), 48-62, 56.
140 Velthuis and Coslor, The Financialization of Art, 478.
141 Cf. Einav and Levin, The Data Revolution and Economic Analysis, 20; Lepper: Big Data, Global Villages, 143; Szabo: Transforming Art History Research, 168; Zorich, Transitioning to a Digital World, 32f.
142 Schich, Figuring out Art History, 47.
143 Cf. Taylor, Schroeder, and Meyer, Emerging practices and perspectives on Big Data analysis, 8. Cf. Zorich, Transitioning to a Digital World, 35f.
144 Stephen Bury and Andrew W. Mellon with Ralph Baylor, Samantha Deutch, Sumitra Duncan, Julie Ludwig, Ellen Prokop and Louisa Wood Ruby, Art History in Digital Dimensions. The White Paper. A report on the proceedings of the symposium “Art History in Digital Dimensions” held in October 2016 at The Phillips Collection, Washington D.C. and the University of Maryland, College Park, February 2017, The Getty Foundation, The Samuel H. Kress Foundation, http://dah-dimensions.org/wp-content/uploads/2017/03/Art-History-in-Digital-Dimensions-White-Paper.pdf, accessed on 31 May 2017.
145 Coslor and Spaenjers, Organizational and epistemic change, 58.
146 Schich, Figuring out Art History, 54.
147 Velthuis and Coslor, The Financialization of Art, 477.
148 Alain Quemin, The Hierarchy of Countries in the Contemporary Art World and Market, in Österreichische Zeitschrift für Geschichtswissenschaften, 17/2&3 (2006), 35-57, 49.
149 Cf. Antoinette Friedenthal, John Smith, his Catalogue Raisonné of the Works of the Most Eminent Dutch, Flemish, and French Painters (1829–1842) and the ‘stigma of PICTURE DEALER’, in Journal of Art Historiography, 9 (2013), 1-20, https://arthistoriography.files.wordpress.com/2013/12/friedenthal.pdf, accessed on 30 May 2017.
150 Cf. Quemin, The Hierarchy of Countries, 35f.
151 Cf. Joyeux-Prunel, Dossin, and Matei, Spatial (Digital) History, 51.
152 van Ginhoven, Connecting art markets, 7.
153 Gaehtgens, Thoughts on the Digital Future, 25.
154 Lima, Visual Complexity, 61.
155 Florian Cramer, What is ‘Post-digital’?, in APRJA, 3/1 (2014), Post-Digital Research, ed. Christian Ulrik Andersen, Geoff Cox and Georgios Papadopoulos, http://www.aprja.net/what-is-post-digital/, accessed on 30 March 2017. Cf. on the correlations between race and computer history Tara McPherson, Why Are the Digital Humanities So White? or Thinking the Histories of Race and Computation, in Matthew K. Gold, ed., Debates in the digital humanities (Minnesota: University Press, 2012), 139-160, 149, 152f, and 155.
156 Quemin, The Hierarchy of Countries, 35f.
157 Cf. Schäffner, Instrumente und Bilder, 94.
158 Chun, 59f.
159 Harley, Deconstructing the Map, 61.
160 Cf. Karin Knorr Cetina, From pipes to scopes: The Flow Architecture of Financial Markets, in Distinktion. Journal of Social Theory, 4/2 (2003), 7-23, 20.
161 Paraphrasing Patchen Markell one could say: “Such representations of [the art world] are already acts of recognition, and also failures of acknowledgment.” Patchen Markell, Bound by Recognition (Princeton: University Press, 2003), 171.
162 Knorr Cetina and Reichmann, Living Data in Financial Markets, 164.
163 Knorr Cetina and Reichmann, Living Data in Financial Markets, 164.
164 Michel Callon, Actor-network theory – the market test, in The Sociological Review, 47/1 (1999), 181-195, 189.
165 Knorr Cetina and Reichmann, Living Data in Financial Markets, 169.
166 Einav and Levin, Economics in the age of big data, 719.
167 Chun, Programmed Visions, 172.
168 Chun, Programmed Visions, 59.
169 Elena Esposito, The structures of uncertainty: performativity and unpredictability in economic operations, in Economy and Society, 42/1 (2013), 102-129, 122f.
170 Esposito, The structures of uncertainty, 122f.
171 Esposito, The structures of uncertainty, 122f.
172 In late Enlightment anagnorisis could be used as a poetic technique of critique to question social knowledge and identity formation. Cf. Rippe, Dramatische Aufklärung, 251f.
173 Elena Esposito, The Future of Futures. The Time of Money in Financing and Society (Cheltenham: Edward Elgar, 2011), 68.
174 Cf. Niall Atkinson, The Noisy Renaissance. Sound, Architecture, and Florentine Urban Life (Pennsylvania: Penn State University Press, 2016).